Plan, measure and review your portfolio one strategy at a time
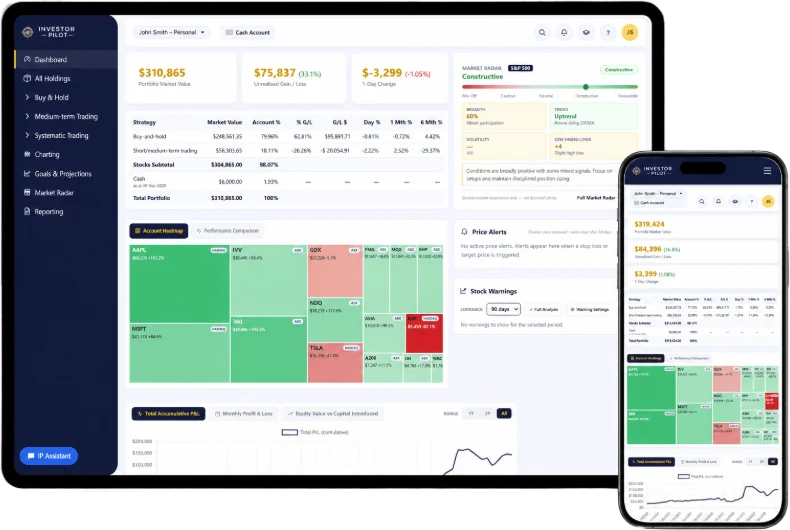
Most portfolios mix several approaches: core holdings you keep for years, ETFs, and a few trades. Investor Pilot measures each one on its own, against the return your goal needs.
Plan: set the goal
Enter what you're investing for, the target amount, the date and what you'll keep contributing. Investor Pilot calculates the yearly return the portfolio needs and projects the balance forward, before and after inflation.
- Required-return calculation for each goal
- Growth projection with contributions and fees
- Retirement drawdown: flat, indexed or in today's dollars
- Risk profile matched to your timeframe

Organise: allocate each holding to one of your strategies
Choose the strategy a holding belongs to and Investor Pilot does the rest. A share bought to keep for ten years is judged differently from a three-month trade, so each strategy gets its own return.
- Buy and hold, ETFs, medium-term trading and systematic strategies
- Upload trade confirmations from CommSec, CMC Markets, nabtrade and Westpac
- Add trades from any other broker by hand
- Cash accounts, dividends and realised gains tracked per account
| Strategy | Value | Gain | 1 month | 6 months |
|---|---|---|---|---|
| Buy and hold | $239,995 | +57.2% | +2.9% | +0.8% |
| Medium-term trading | $59,342 | +12.4% | −6.2% | −4.8% |
| Systematic trading | $48,610 | +24.2% | −2.7% | +9.1% |
Measure: see what is working
Returns are shown by strategy, by account and for the whole portfolio, for the financial year or the calendar year, and against the S&P 500 and ASX 200.
- Performance by strategy, account and goal
- Comparison with the S&P 500 and ASX 200
- Exposure by sector and country, including what's inside your ETFs
- Holdings heatmap to spot winners and laggards at a glance
Review: stay disciplined when markets move
Market signals and stock warnings give you a reason to act, or not to act, that comes from your rules rather than the news.
- Market Radar: one market condition reading, from Risk Off to Favourable, with a suggested position size
- The internals behind it: breadth, trend, VIX, distribution days and 52-week highs against lows
- Gold, oil, copper, Bitcoin, Treasury yields, US equity factors and index performance on one screen
- Nine daily stock warnings, including a close below the 50-day average, a high-volume sell-off and a volatility spike
- Stop-loss and target alerts by email and in the app
- Short lessons in Flight School, inside the app


See which of your strategies is working in ten minutes.
Upload your broker trade confirmations or add holdings by hand. Free for 10 holdings, no card needed.
- Free for 10 holdings
- No credit card
- Your data stays if you cancel